Goldilocks Webinars
Webinars within Goldilocks, provides you and your team, a compressive overview of any synced webinars that have taken place or are scheduled to do so within your account. Quickly see your webinar name, description, registrations and more.
To access Webinars within Goldilocks, simply navigate to Marketing Center > Webinars.
Let’s dive in to the information available within Webinars.
Webinars Synced Data
Upon selection of Webinars, you will be presented with synced Webinar details. By default, Webinars includes the below datapoints.
- Name- The name of your synced webinar
- Description – The description given to your webinar via the webinar platform
- Platform- The platform in which your webinar is hosted
- Registrants- Contacts who have registered for your webinar.
- Attendees- Those who registered & attended your webinar once it took place.
- Did Not Attend – Those who registered & did not attend your webinar.
- Starts At- The date and time in which the event is scheduled to take place, or did take place
- Ends At- The date and time in which the event is scheduled to end or ended.
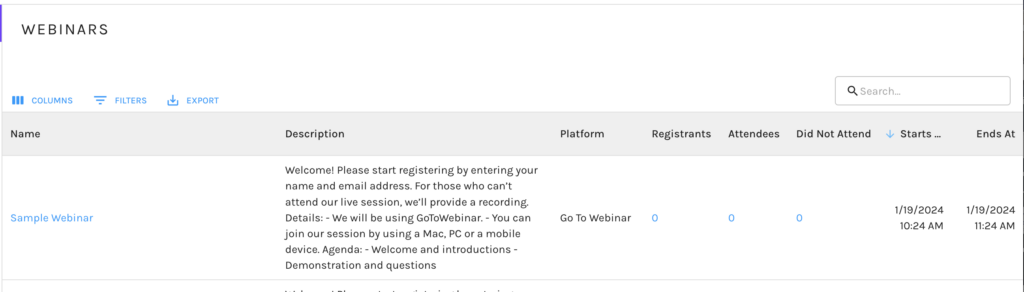
Via Webinars, you have the ability to choose which columns are present on the dashboard, by selecting the column chooser in the top left corner of the dashboard.
Filters allow you to filter based on keywords from the Name or Description.
Quickly export your data as a CSV file, Excel file or Print via the Export button.
Webinar Dashboard
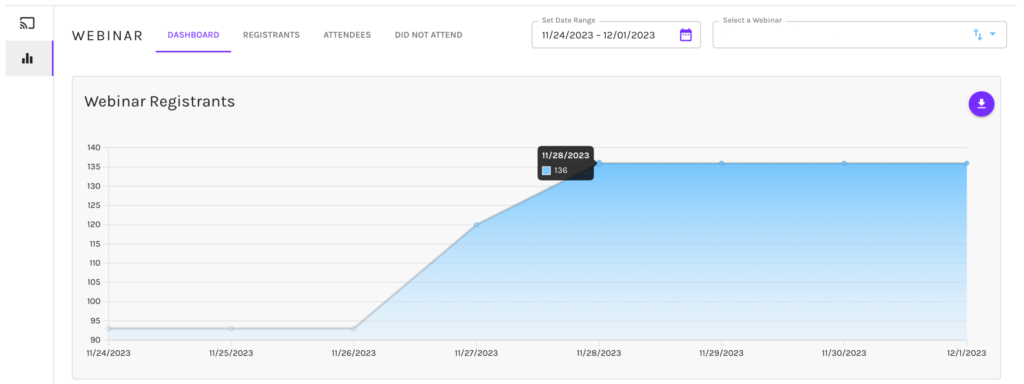
Within Webinars, you will notice all synced webinars can be selected, to drill down even further. Upon selection, you will be taken to the Webinar Dashboard.
Here you will see a line chart of Webinar Registration during a set date range. Hover over a date to select and view any contacts who registered on selected date.
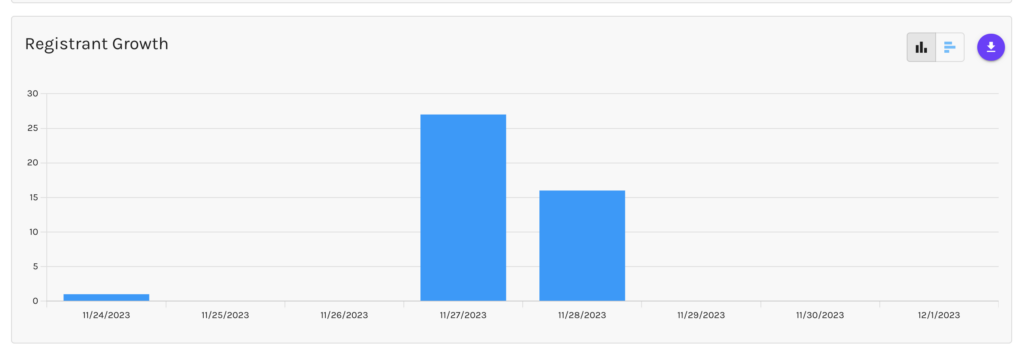
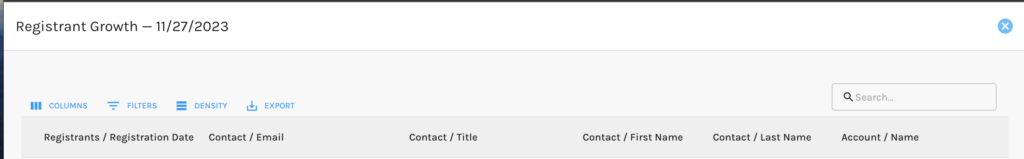
Just beneath, you will find a bar chart of your Registration Growth during a set date range. Selecting a bar, will pop up all contacts who registered on your selected date. This chart allows you to display the bars vertically and horizontally.
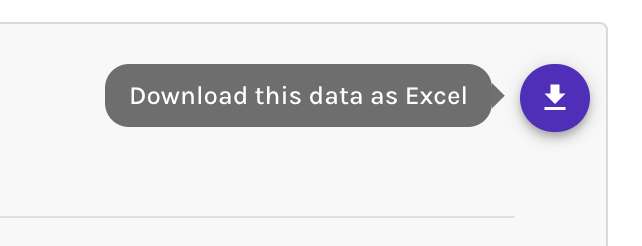
Each graph will allow you to quickly download the data as an Excel file from your selected date range, via the export button in the top right corner.
When viewing contacts from either of these graphs, you will notice that you can adjust the columns displayed, apply filters, adjust the density of the data, or download all contacts as a CSV file, Excel File, or Print.
The Webinar Dashboard, also allows you to view Registrants, Attendees & Did Not Attend. Simply click on which you would like to view.
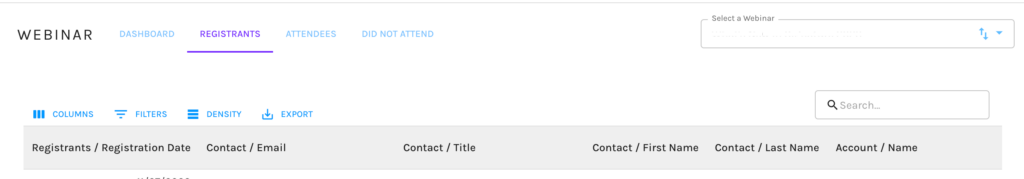
Each Dashboard allows you to adjust columns, add filters, change the density, or export the data.
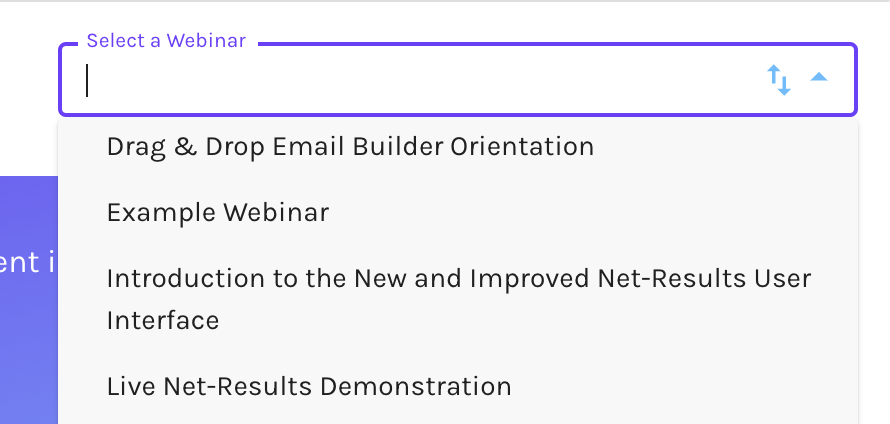
In the top right corner of the Webinar Dashboard, you will see a drop down, in which you can “Select a Webinar”. All synced webinars are available to select, and the label will allow you to sort by Label or Starts At.
If you would like to access the Webinar Dashboard, from the Pulse, navigate to Reporting > Dashboards> Webinars.
If you have any questions on Goldilocks Webinars, or would like a walkthrough, please reach out to our great Customer Success Team at support@net-results.com. We are happy to assist with any questions you may have.