Quick Overview of Dashboards
Net-Results provides a robust suite of reporting tools. These include scheduled reports sent straight to your email and also our Dashboards, which provide an ongoing overview of key reports in a visual format that can quickly be filtered by date range and other relevant information.
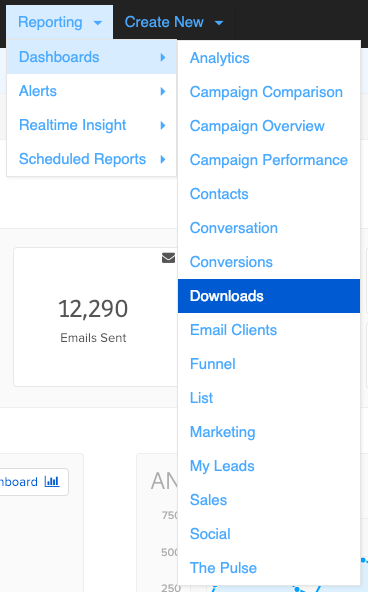
The Downloads Dashboard
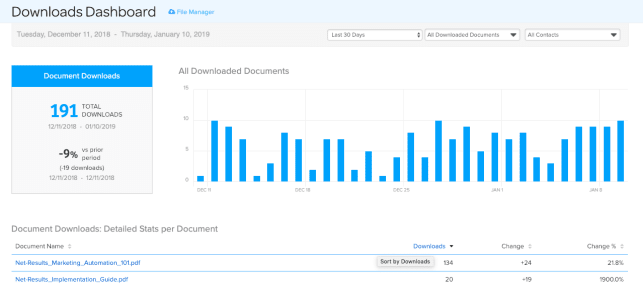
The Downloads Dashboard can be toggled between a general view of “All Downloaded Documents” or statistics specific to a particular asset. As with other dashboards in Net-Results, you may also determine the date range and segment, applying these as a filter to your data.
Whichever view you choose, a more detailed breakdown of the information covered in the dashboard will be provided directly below the graph.
For the general view, this refers to a breakdown of stats related to specific documents, expanding upon the broad overview in the graph.
However, if you toggle the dashboard to zero on a specific piece of downloadable content, this breakdown will change to reflect a list of the known contacts who downloaded the item in question.
This simple but useful dashboard will allow you to keep tabs on the performance of your white papers, how-to guides, and other essential pieces of downloadable content that provide value to customers and help encourage prospects to convert.