Quick Overview of Dashboards
Net-Results provides a robust suite of reporting tools. These include scheduled reports sent straight to your email and also our Dashboards, which provide an ongoing overview of key reports in a visual format that can quickly be filtered by date range and other relevant information.
The Email Clients Dashboard
With the rise of smartphones and tablets, it’s become more important than ever to understand how your prospects are consuming the information you provide. These preferences not only drive design choices, but other key considerations, such as when and where downloadable content is promoted.
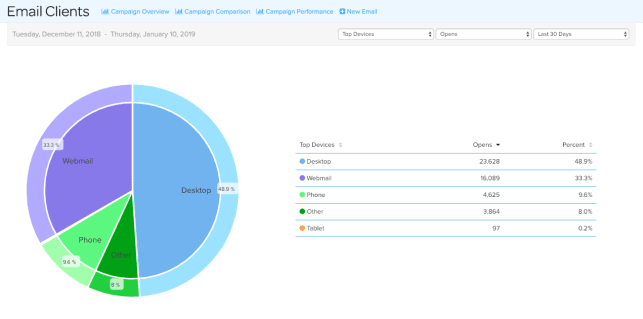
The Email Clients Dashboard provides you a breakdown of how mailable contacts, those prospects with whom you engage directly via email, are viewing your emailed content in a view called “Top Devices.”
The breakdown differentiates between the following common modes of consumption:
- Desktop
- Webmail
- Phone
- Table
- Other
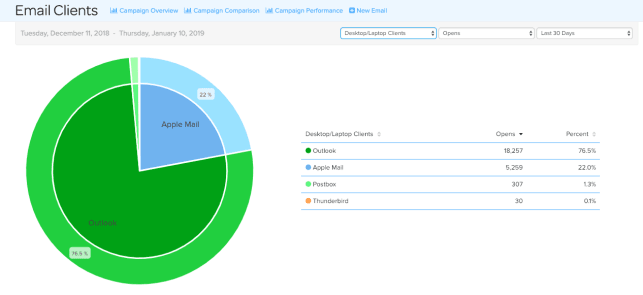
In addition to this general breakdown by device type, you may toggle the main pie graph to view a breakdown of client by device type. You may also specify whether to view by gross or unique opens.
Opens Per Day
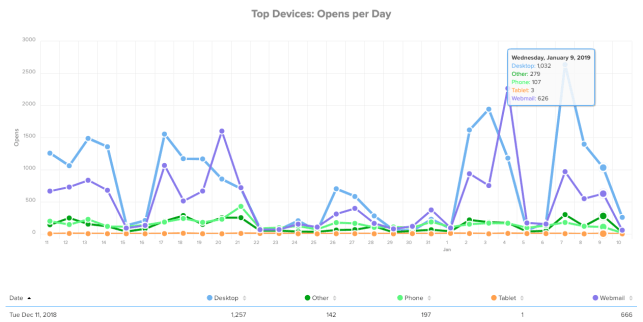
Aside from a breakdown of the devices and specific email clients used to view and consume emailed content among your engaged prospects, this dashboard also provides an overview of daily open rates.
This view is directly linked to the first, and can be toggled using the same dropdown menu that allows you to choose the more general overview of “Top Devices” or the more specific views associated with each designated device type. In addition, you may again specify gross or unique opens when displaying these metrics. Finally, as with other dashboards, you may select a specific date range for which to view these essential metrics.