Quick Overview of Dashboards
Net-Results provides a robust suite of reporting tools. These include scheduled reports sent straight to your email and also our Dashboards, which provide an ongoing overview of key reports in a visual format that can quickly be filtered by date range and other relevant information.
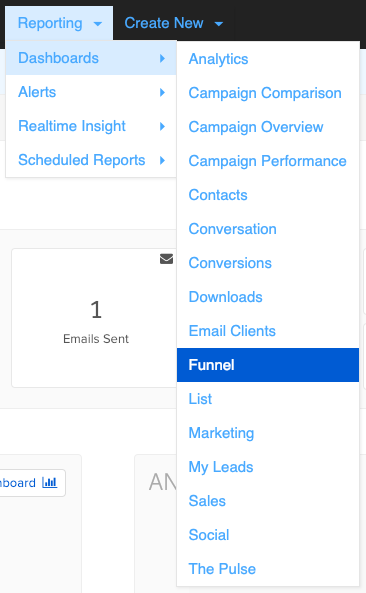
The Funnel Dashboard
The Funnel Dashboard is customized to you by virtue of the lead stages you have established. While all marketing and sales funnels follow a general flow from top of the funnel (prospects) to bottom of the funnel (conversions), the various stages that define that journey are subject to variation.
To that end, you are able to build and customize your funnel view in Net-Results by adding or removing lead stages via the provided menu. Based on the information recorded in Net-Results, you’ll then be able to view a charted breakdown of what your current funnel looks like.
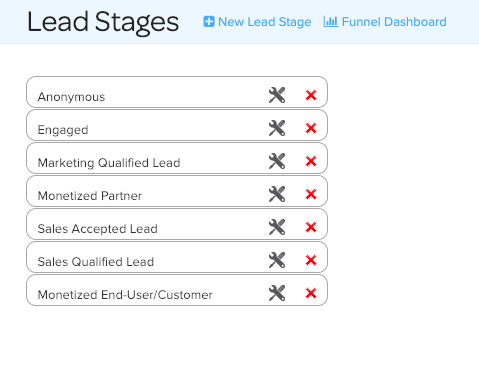
Lead Stages
Leads Stages comprise the core components of the Funnel Dashboard. These designated milestones on your prospects’ journey from the top of the funnel to full conversion are determined by you. Simply select “Add Lead Stage” from the top menu to add, edit, or remove a new milestone that you wish to track or stop tracking as part of your marketing and sales funnel.
Some examples of lead stages:
- Prospect
- Engaged Prospect
- Viewed a Demo
- Requested a Quote
- Purchased
Lead stages within the funnel can be organized by specifying their order within the lead stage order settings. To get here, navigate to “New Lead Stage” and select the small tool icon beside the lead whose order you wish to specify. This begins with 1, which places a lead stage at the very top of the funnel.
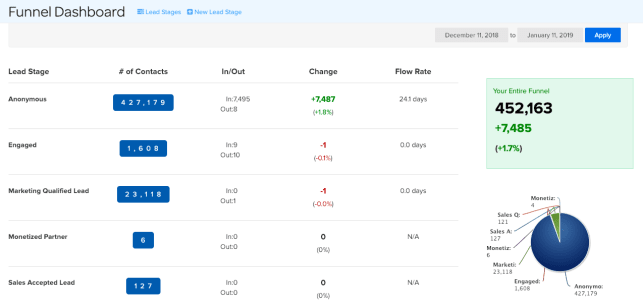
Presentation
The information of the Funnel Dashboard is provided in a few different ways. First, there is a general breakdown of information by Lead Stage from the top of the funnel to the bottom. Off to the side, you will notice a total account of your funnel with the first metric donating the very first stage (top of the funnel) added together with those who have progressed further along.
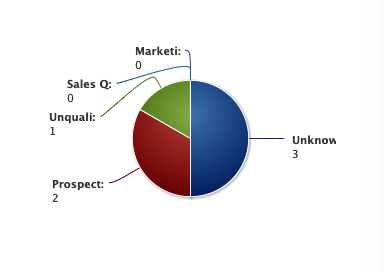
Finally, a small pie graph offers a clear and impactful overview of each of the stages together. There is even an option to download this information as a CSV file by clicking the designated icon below the pie graph.