Goldilocks Social Statistics
If you’re using Goldilocks to schedule your Social Post, all of the statistics from your Facebook or LinkedIn posts can be found under “Social Page Overview”.
Navigating to the Social Page Overview Dashboard
There’s a few ways to get to the Social Page Overview Dashboard.
1. Marketing Center –> Social Posts –> Social Page Overview

2. Reporting –> Dashboards –> Social Page Overview

Filtering Options
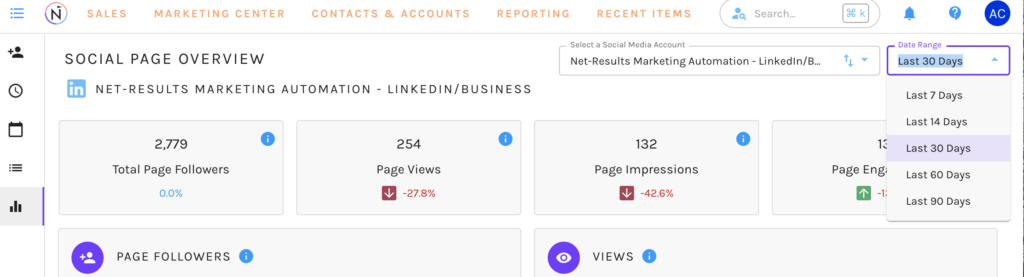
Explore with ease! Just head to the top right and use the filter bar to discover the statistics for the Social Media account you’re interested in.

You also have the option to filter by date via the date range picker on the top right. This allows you to filter for statistics from the last 7, 14, 30, 60, or 90 days.
LinkedIn Statistics Overview
The Social Statistics for LinkedIn Include the following metrics:
Total Page Followers – The total number of people who currently Follow your LinkedIn page.

Page Views – The number of times your content has been fully displayed on a user’s screen. When someone scrolls through their feed and your post appears, it counts as a view, regardless of whether they interact with it. Views indicate the potential reach and visibility of your content.

Page Impressions – The total number of times your content was displayed on a user’s screen, whether or not it was clicked on or interacted with.
LinkedIn Graphs and Charts
Page Engagement – Any action or interaction that users take with your content. These include likes, clicks, comments, and shares.

Page Followers By by Country, City and Industry

Views vs Unique Views
- Views – are number of times your content was clicked on and fully displayed to a user.
- Unique Views – The number of times your content was clicked on and fully displayed to a unique user.

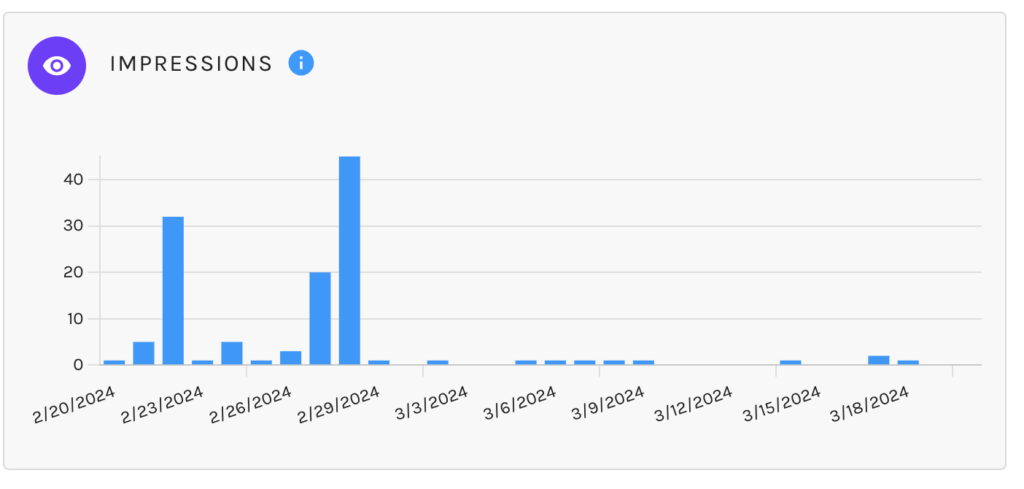
Impressions vs Unique Impressions
- Impressions – Are the total number of times your content was displayed on a user’s screen, whether or not it was clicked on or interacted with
- Unique Impressions – Are the total number of times your content was displayed on a unique user’s screen, whether or not it was clicked on or interacted with.

Organic vs Paid Follower Gains
- Organic – These are followers who discover your account naturally, without any paid promotion or advertising. They may have found your profile through various means, such as recommendations from mutual connections, content you’ve shared, engagement with your posts, or simply through searching for topics or individuals related to your account.
- Paid – These are followers that you acquire through paid advertising or promotion campaigns.

Views vs Engagements
- Views – Are the number of times your content has been fully displayed on a user’s screen. When someone scrolls through their feed and your post appears, it counts as a view, regardless of whether they interact with it. Views indicate the potential reach and visibility of your content.
- Engagements – Are any action or interaction that users take with your content. These include likes, clicks, comments, and shares.

Average Impressions – Are the total number of times your content was displayed on a user’s screen, whether or not it was clicked on or interacted with.

Average Views – Are the number of times your content has been fully displayed on a user’s screen. When someone scrolls through their feed and your post appears, it counts as a view, regardless of whether they interact with it. Views indicate the potential reach and visibility of your content.

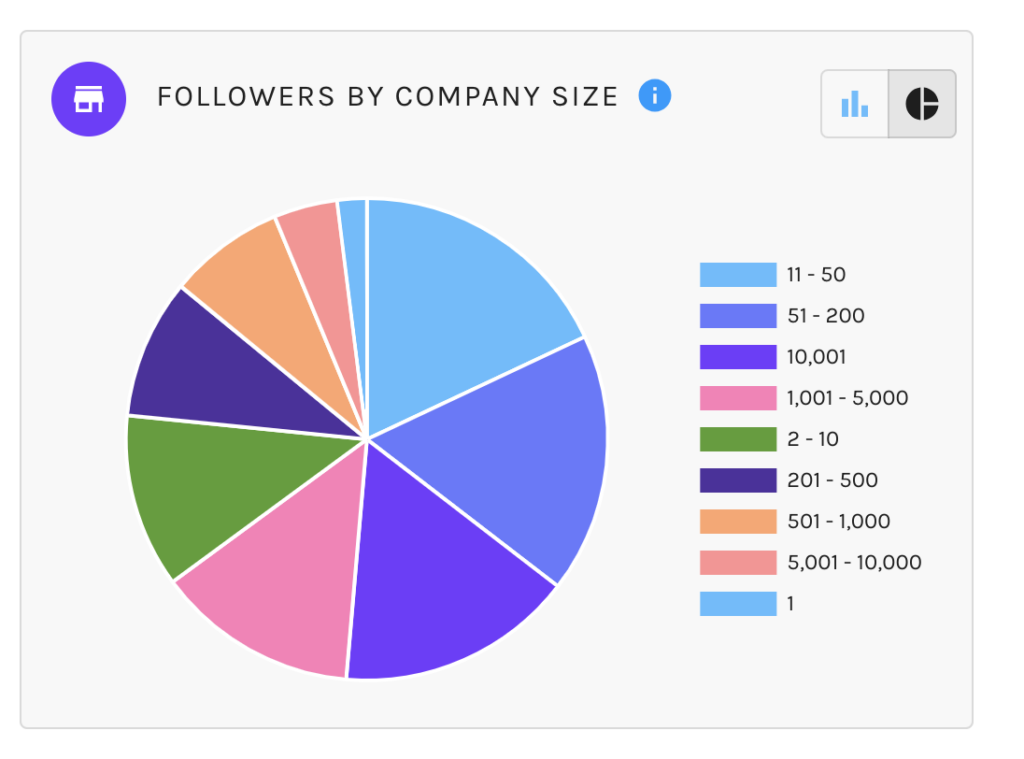
Followers By Company Size – People who have followed your Page
Facebook Statistics Overview
The Social Statistics for Facebook Include the following metrics:
Total Page Followers – The total number of people who have followed your Page.

Total Page Likes – The total number of people who have liked your Page.

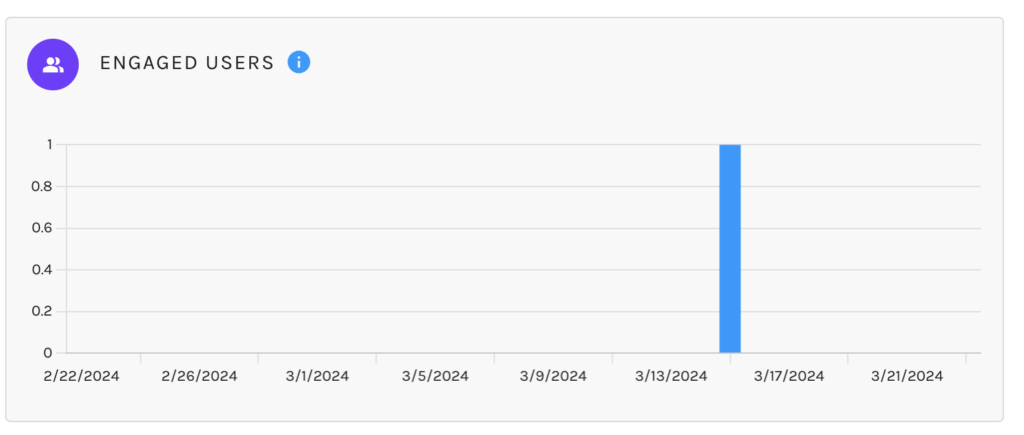
Engaged Users – The number of people who clicked on any of your content. Stories that are created without clicking on Page content (ex, liking the Page from timeline) are not included.
Page Impressions – The number of times any content from your Page or about your Page entered a person’s screen. This includes posts, stories, ads, as well other content or information on your Page.

Facebook Graphs and Charts
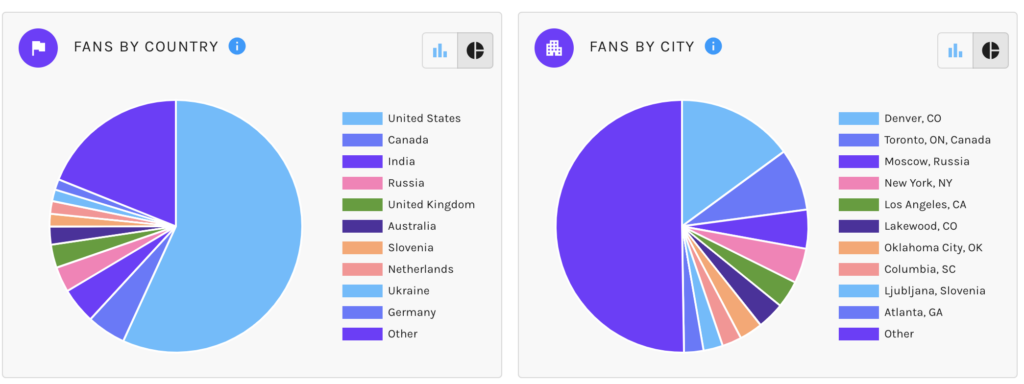
Fans by Country, City
Reactions – Total Reactions on all your posts by type of Reaction.

Organic vs Paid Impressions
- Organic – The number of times your Facebook Page and Page content was on screen through organic distribution.
- Paid – The number of times any post or story content from your Page or about your Page entered a persons screen through paid distribution such as an ad.

Non-Viral vs Viral Impressions
- Non-Viral – The number of times your Facebook Page and Page content was on screen, excluding when they were shown with social information attached.
- Viral – The number of times any content from your Page or about your Page entered a persons screen with social information attached.
- Social Information – Social information displays when a persons friend interacted with your Page, post or story. This includes when someones friend likes or follows your Page, engages with a post, shares a photo of your Page and checks into your Page.

Organic vs Paid Reach
- Organic – The number of people who had any content from your Page or about your Page enter their screen through unpaid distribution.
- Paid – The number of people who had any content from your Page or about your Page enter their screen through paid distribution such as an ad.

Non-viral vs Viral Reach
- Non-Viral – Reach from the organic or paid distribution of your Facebook Page and Page content, excluding when they were shown with social information attached
- Viral – Reach from the organic or paid distribution of your Facebook Page and Page content when they were shown with social information attached.
- Social Information – Social information displays when a persons friend interacted with your Page, post or story. This includes when someones friend likes or follows your Page, engages with a post, shares a photo of your Page and checks into your Page.

Average Impressions – The number of times any content from your Page or about your Page entered a person’s screen. This includes posts, stories, ads, as well other content or information on your Page.

Average Reach – The number of people who saw any content from your Page or about your Page.

Average Engaged Users – The number of people who clicked on any of your content. Stories that are created without clicking on Page content (ex, liking the Page from timeline) are not included.
